Insights from ship data b/w 1750-1850
INTRODUCTION:
In the mid-eighteenth to nineteenth centuries, navigating the open ocean was an imprecise and often dangerous feat. In order to calculate their daily progress and avoid running/sailing into the unknown, a ship’s crew kept a detailed logbook with data on winds, waves, and any remarkable weather.
Handwritten in archived logbooks, these rich datasets were nearly impossible to study until the European Union-funded their digitization in 2001.
The existence of abundant meteorological data from logbooks of different European countries constitutes a common and invaluable heritage of the most outstanding scientific interest. The logbook data will help in exploring several historical events which happened in the path, such as the trade routes, anomalies in trade routes, piracy data, the relationship of European Countries with Asian, American and African countries, etc. These logbooks are a unique source of information which cannot be obtained from any other way and will help to understand climate variability for a period and area (the oceans) with scarce data until now. The availability of such data to the scientific community will contribute to better detection of climate change.
We have historical ship logbook data for a century from 1750-1850 opened and digitized by EU. The data set contained around 300 thousand numbers of data on ship routes. We have tried to find some insights from it through data mining, Clustering, Time-Series Plotting of Routes and Natural Language Processing to get some interesting results from it.
DATASET DESCRIPTION
This data comes from the Climatological Database for the World’s Oceans 1750-1850 (CLIWOC), version 1.5 data release.
The primary data file is CLIWOC15.csv. The columns in this table are described on this page (scroll down to the table that starts with “Field abbreviation”). It includes 280,280 observational records of ship locations weather data, and other associated information.
Source:
https://www.kaggle.com/cwiloc/climate-data-from-ocean-ships
http://webs.ucm.es/info/cliwoc/
http://webs.ucm.es/info/cliwoc/content/CLIWOC15all.htm
The data set consisted of Ship Names, their nationality, Voyage From, Voyage To, UTC (Date and Time of recording Data), Life on Board Memo, Voyage Initial date, Weather and Climate Info, War Info, Sea Temperature, Biological Diversity data, and different kinds of the memo.
The information maintained in the database was not consistent every time since many fields were missing and NA.
Therefore, we had to filter out the NULL fields for proper analysis of the data set.
TOOLS USED:
Language Used For Analysis: Python
Libraries Used: Matplotlib, Numpy, Pandas, TensorFlow, Scikit Learn, Seaborn, Geopy, NLTK, Keras.
Software used: Ms Excel
DATA PREPROCESSING
We extracted only those columns from CLIWOC15.csv file which was necessary for them.
For Route Classification, we extracted lon3, lat3, nationality, VoyageIni(Starting date of Voyage), Date and Time, VoyageTo, VoyageFrom, Weather, WindSpeed, WarsAndFights, Wars and Fights Memo.
These header file data were sufficient enough to plot and find out the trade routes taken by different nationalities across the different time period.
VoyageIni was first pre-processed since it was in YYYYMMDD format. Then, different nationalities ship was classified into different groups.
After the routes were classified into different time intervals of 10-20 yrs. This was done to make a time series data of the route for further analysis.
ANALYSIS PERFORMED AND THEIR ALGORITHMS:
SIMPLE ROUTE ANALYSIS:
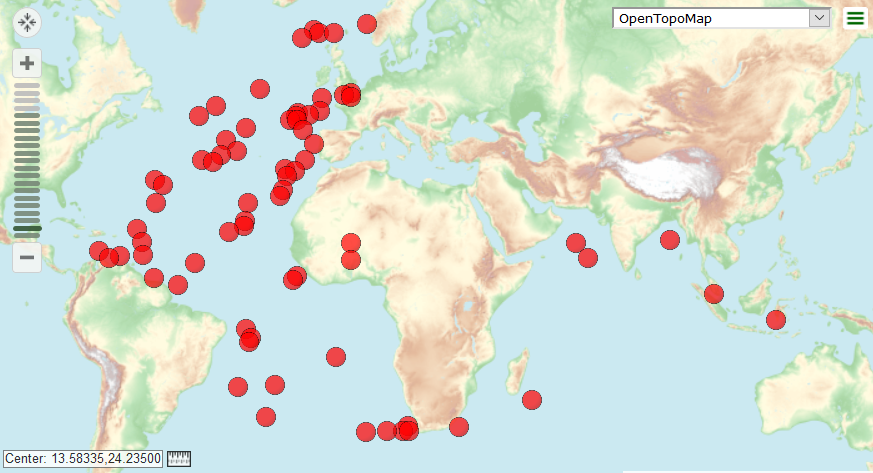
The grouped pre-processed data was plotted on the map with the use of Lat3 and Lon3 given in there. The plotted figure and the inferred information is as follows:
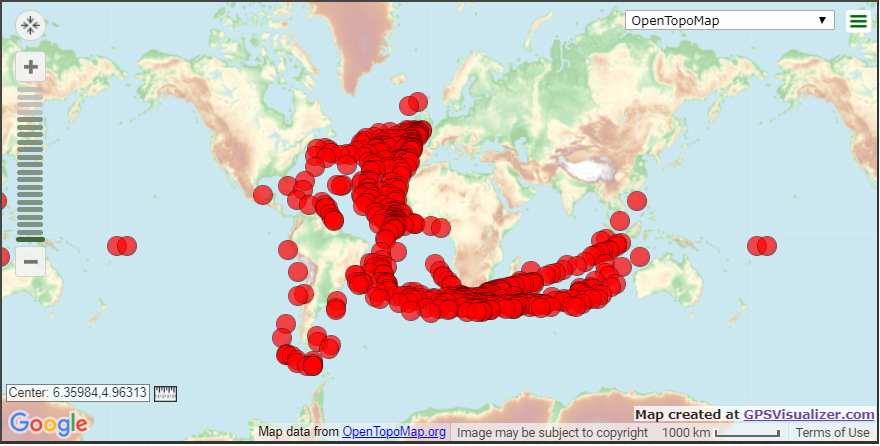
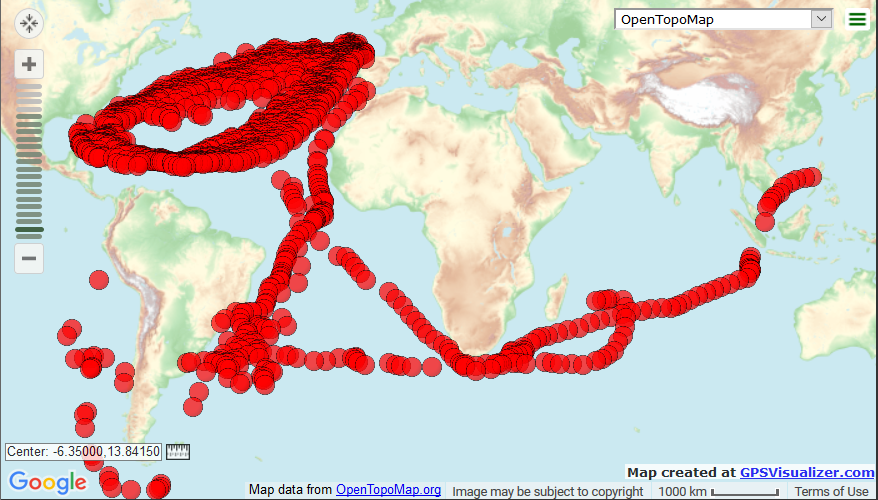
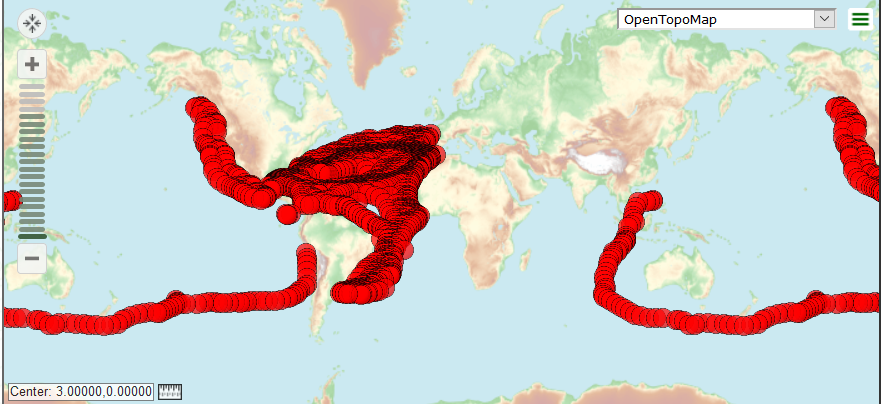
BRITISH
1750-79
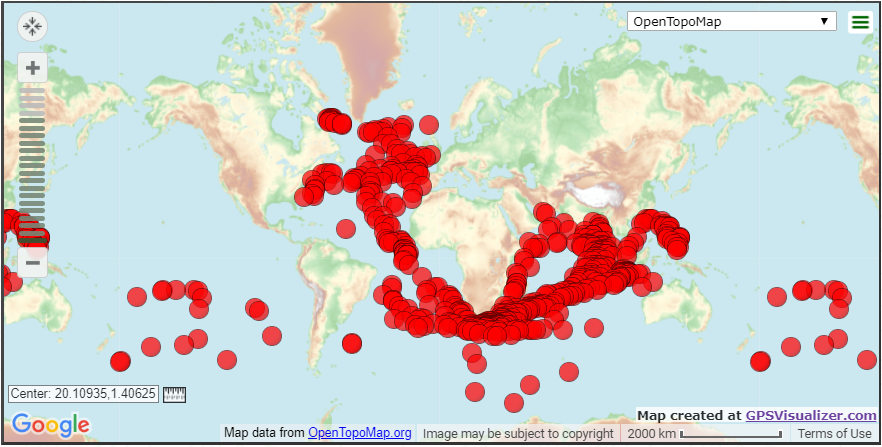
We can clearly see that the British ship route in the 1750-79 is mainly focused on India as they were the rulers at that point of time. They took the fastest route via the cape of good hope to reach India.
North America was also under colonialism till 1765 thus we can see the movement of British ships in these areas too.
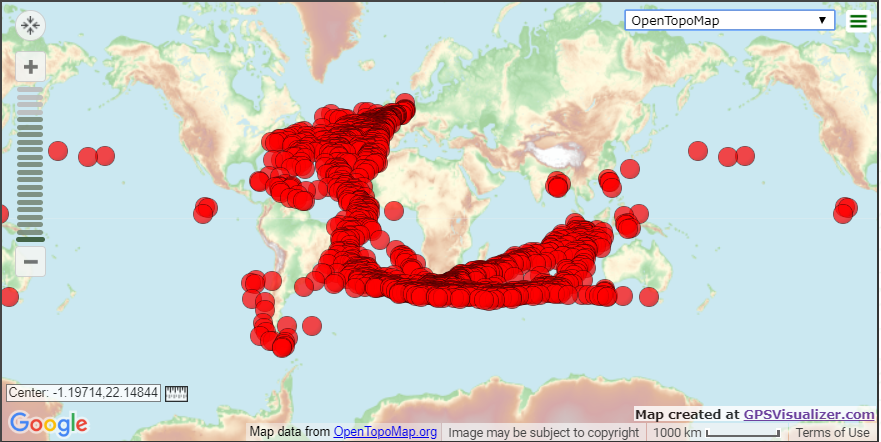
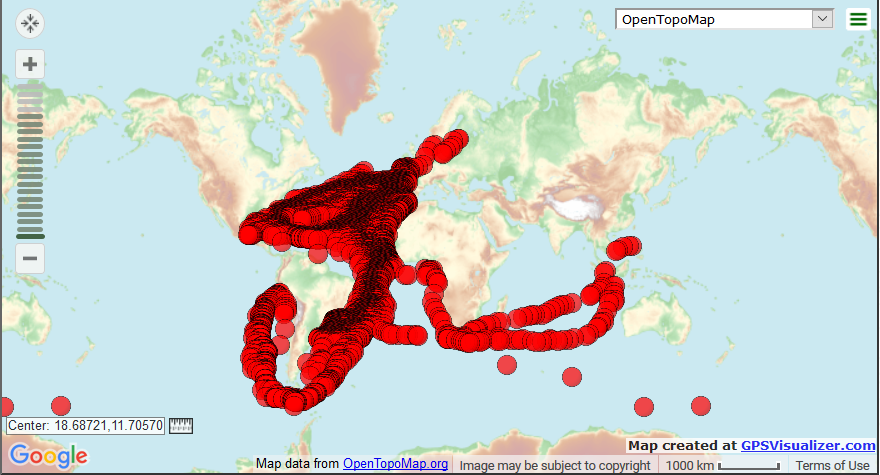
1780-99
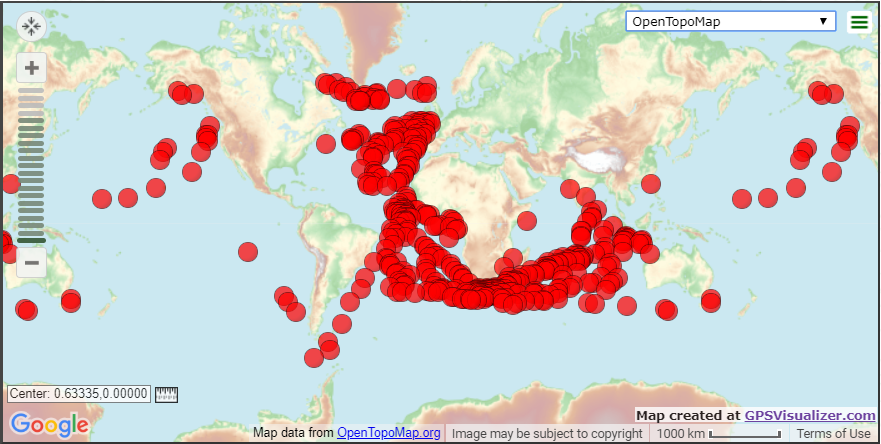
We can see that as they ruled India till 1947 so there is no significant change in their route during this period too.
The Britisher during the 1790s attacked and captured ports of South America thus we can see the new route formation during this period.
They still have some trading ports in North America as can be seen. They even travel north America via Cape Horn (The lowest point of South America).
There are some routes heading to Australia as at that point of time the convicts from the British Rule were transported to these places.
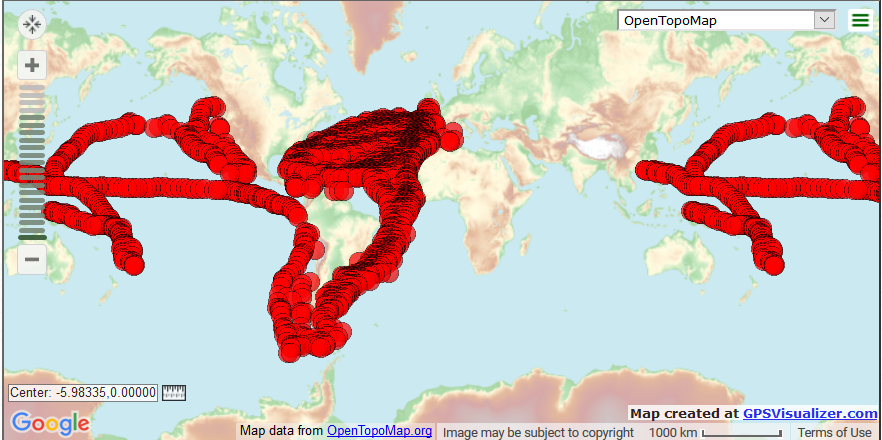
1800-30
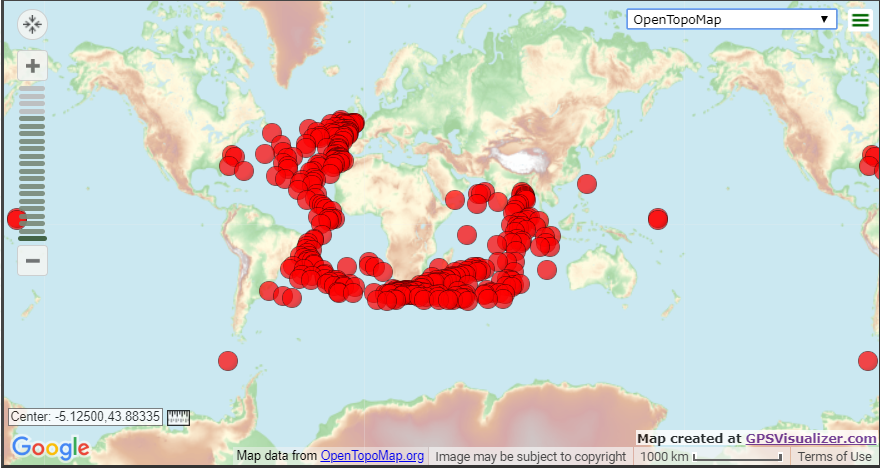
During this period, Britishers were basically focused on India and South Africa as they were ruling these countries.
But we can see that some ships went to North America too for trade and other things.
Britisher went to a few other places too for transporting the captives.
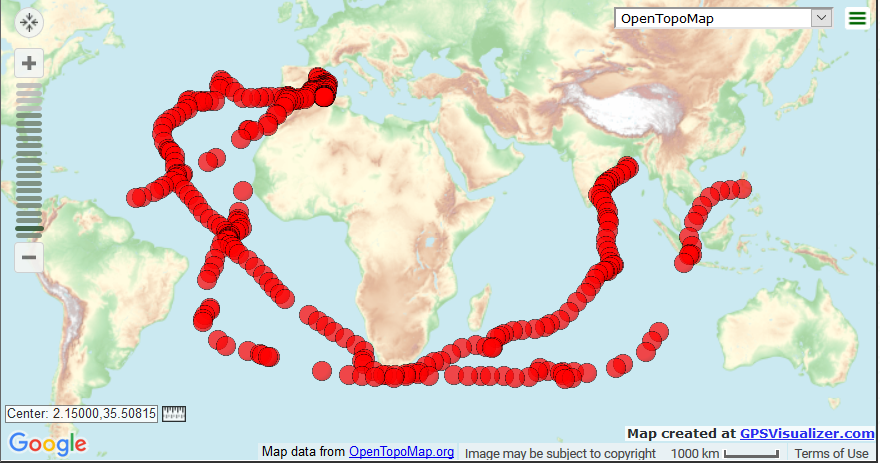
DUTCH
1770-99
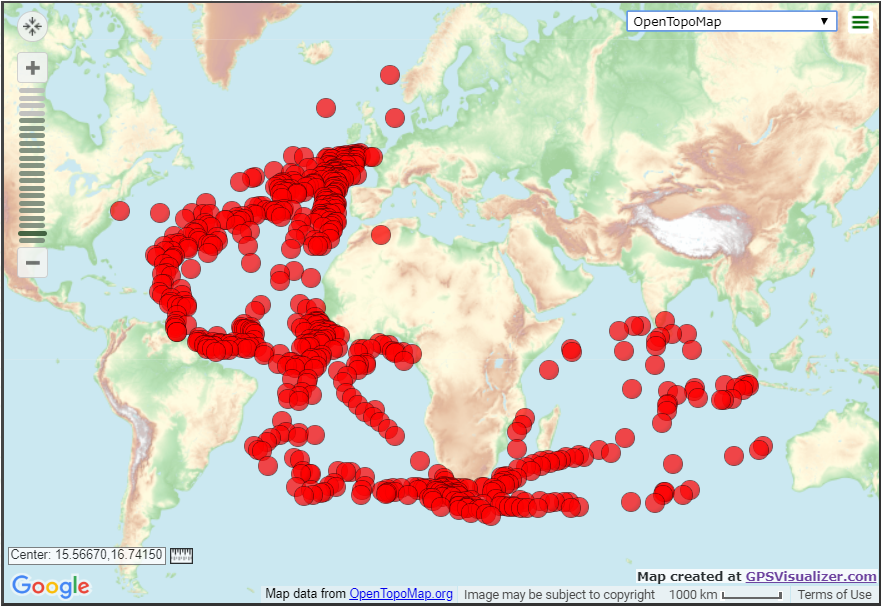
As Dutch invaded the cape of good hope, part of South America, the golden coast of Africa and some part of southeastern Asia so their route is just based on their colonial rules.
They captured parts of south-east Asia, parts of America, Africa and the Caribbean. So, on this basis, we can easily interpret the above ship route.
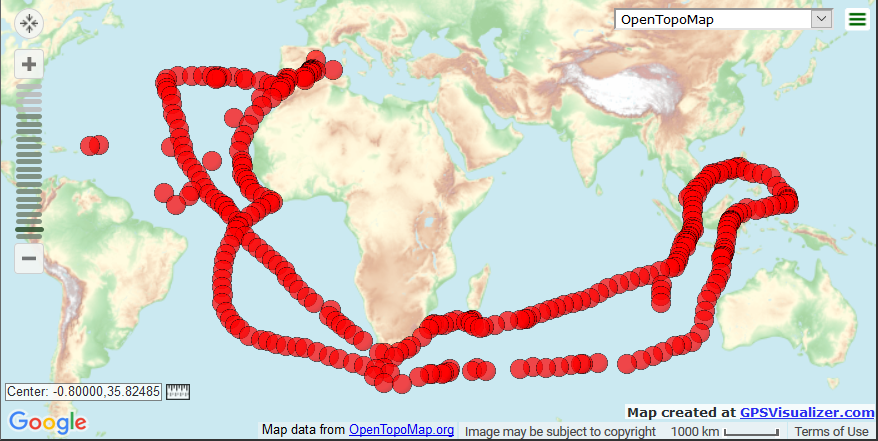
1800-29
In the 1790s there were disputes between British and Dutch. The Dutch rulers were sent off by the Britishers and thus during this period, there was no movement of Dutch ship near India.
Dutch travelled to their colonised countries like Guinea, Jakarta, Cape of Good Hope, some parts of southeastern Asia, parts of North America and South America, they traded with Australia too during this time.
1830-50
There is no significant change just they again started their trade with colonial India and the movement of the ships is more often seen near the southeastern part of Asia and to Australia via the cape of good hope.
There is an increasing trading relationship with the North Americans this might be due to the industrialisation during the mid-19th century.
FRENCH
1750-79
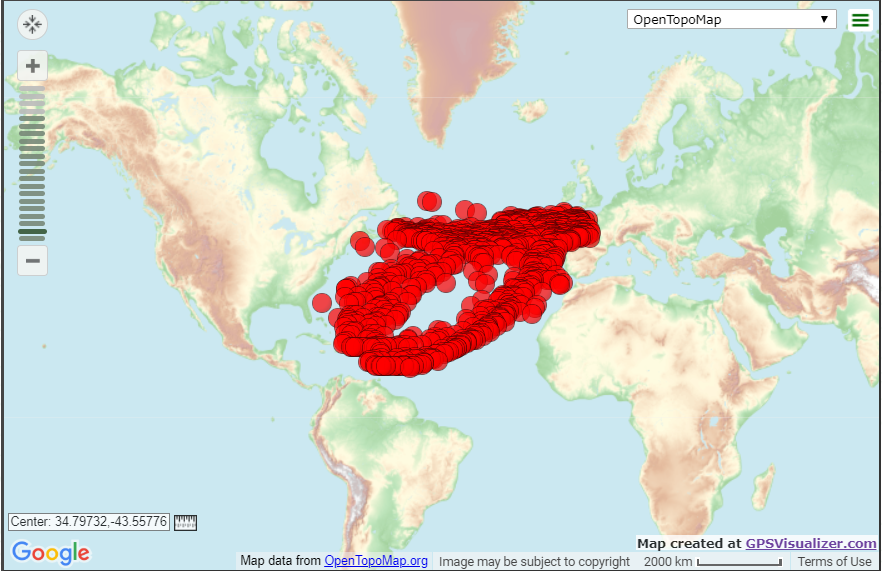
The French empire during this time was in some parts of North America, South America, Dominican Republic, Africa and India.
The ship routes suggest that the French travelled mainly to the colonial part of North America and the Dominican Republic as that empire was the largest one, they had at that point of time.
We can see that no ship sailed to India at this point of time and only a few ships sailed to South America and Africa.
1780-99
No Significant change during this period. Just the frequency of the ship’s voyages increased during this period.
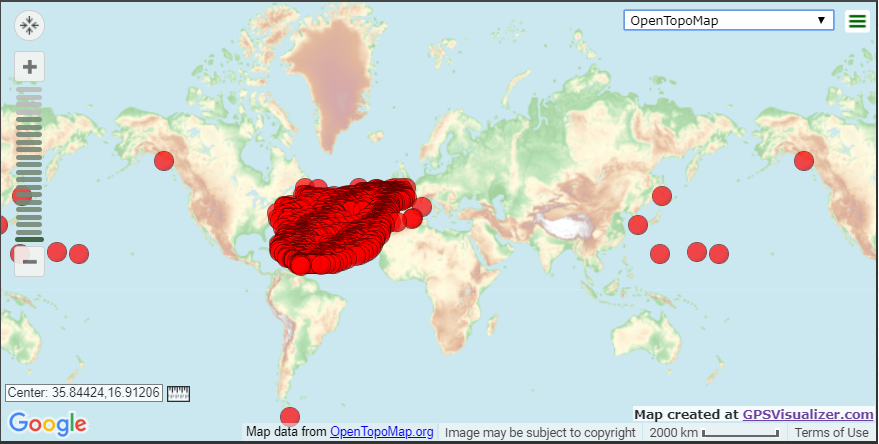
1800-20
As the French Lost the North American empire during the end of the 18th century, thus they have changed their route to India and to the cape of good hope.
This shows the drastic change of the French Rule and how they reduced their voyages this might be possible because they might have lost a huge amount of wealth during the wars.
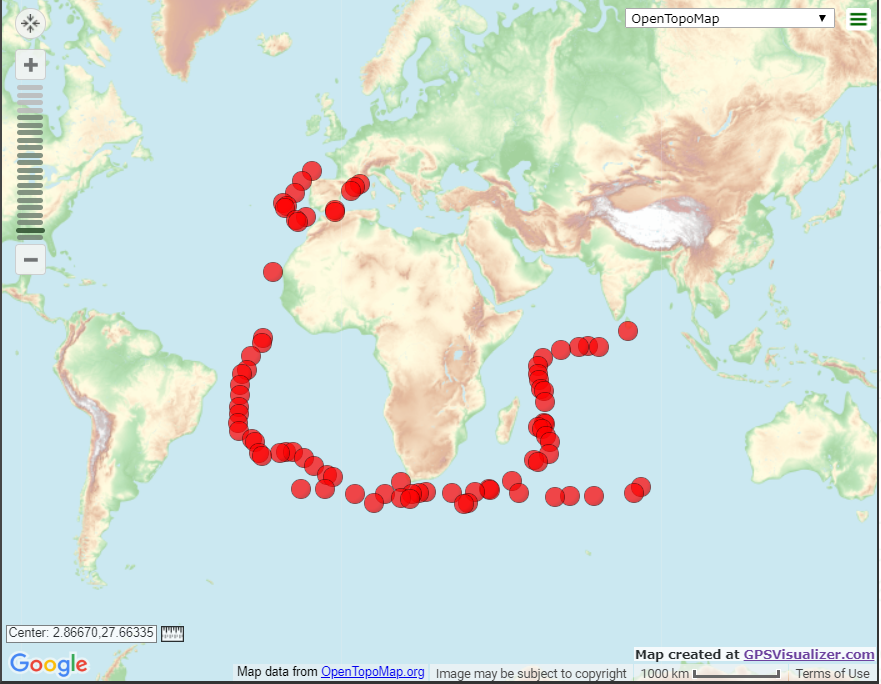
SPANISH
1760-70
During this period, the Spanish empire consisted of the western part of South America, the southern part of North America and the Philippines.
The voyages were generally to their colonies. The cape of good hope was the universal halting point.
Most of the voyages were to the colonial part of North America and South America.
1770-80
The Spanish had established a huge empire in southern and northern America till the 1770s, thus the major voyages are to these colonies regarding trade and other things.
The frequency of the voyages to the Philippines had also increased.
1780-90
We can see that Spanish change their path to the Philippines rather going through the cape of good hope. This is because at that time most of the pirate attacks took place near the southern coast of Africa.
They were going to the Philippines from the north and south America via pacific sea from above the continent of Australia.
It is also quite clear that they had increased their voyages to the eastern part of North America.
1790-99
We can see that Spanish change their path to the Philippines rather going from above the continent of Australia, they went from under the continent of Australia.
This is because of the high turbulence of wind during voyages which eventually lead to the loss of many ships and the crew members.
1800-1830
As Spain lost all their kingdom in the north and south America during the early 1800s. Thus, we can see that no ship was going to those continents and thus the route to the Philippines had also changed via the cape of good hope.
We can also see the involvement of trade with India was started during this time.
1830-1850
Still, there was a small place in Africa where the Spanish ruled. Thus, we can see the routes in the western part of Africa.
There is not much significant change of routes as the Philippines and a small part of Africa was only the places where they rule now.
WIND SPEED ANALYSIS:
We found that in wind force header column in the dataset, the various wind speed was recorded and corresponding the “BEAUFORT FORCE “was also derived from each term in the column. The words in this column were first classified into WEAK OR CALM winds (BEAUFORT VALUE 1-4), Moderate Wind (BEAUFORT VALUE 5-8) and STRONG WINDS (BEAUFORT VALUE 9-12). This analysis was very important since it is directly related to loss because of bad weather and the analysis of change in extreme weather over an area with time.
“A BAG OF WORD” model was created with the 3 classes of winds and words related to each class. Then word analysis was done to find the index number of the rows containing the word related to a particular class of wind. All the extracted indexes of a particular class of wind were first grouped according to different classes and then they were plotted on a map which showed the climatic condition at that place at a given time. This information can be related to find the trends in the extreme climatic condition over an area for a given period of time.
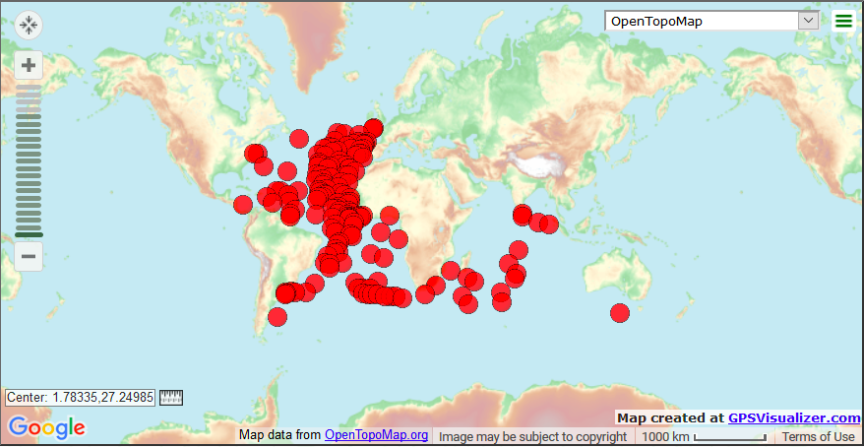
We can see that the frequency of strong winds near the equatorial line is high. The trade winds are the prevailing pattern of surface winds from the east toward the west (easterly) found in the tropics, within the lower portion of the Earth’s atmosphere, in the lower part of the troposphere near the Earth’s equator. The trade winds blow predominantly from the northeast in the Northern Hemisphere and from the southeast in the Southern Hemisphere, strengthening during the winter and when the Arctic oscillation is in its warm phase. Trade winds have been used by captains of sailing ships to cross the world’s oceans for centuries and enabled colonial expansion into the Americas and trade routes to become established across the Atlantic and Pacific oceans.
In meteorology, the trade winds act as the steering flow for tropical storms that form over the Atlantic, Pacific, and southern Indian Oceans and make landfall in North America, Southeast Asia, and Madagascar and eastern Africa, respectively. Trade winds also transport African dust westward across the Atlantic Ocean into the Caribbean Sea, as well as portions of south-eastern North America. Shallow cumulus clouds are seen within trade wind regimes and are capped from becoming taller by a trade wind inversion, which is caused by descending air aloft from within the subtropical ridge. The weaker the trade winds become; the more rainfall can be expected in the neighbouring landmasses.
PIRACY ANALYSIS:
Piracy attacks were occasional in the 18th century. In the war and fights Header files had the info of the fights that occurred in that era. We analysed the Header file and found out the areas where fights used to take place frequently especially in the Atlantic Ocean (Near Europe) since the frequency of Caribbean Pirates was maximum there. We found out 133 cases of from the dataset in which, the worst victims were the Dutch Ships. As maximum ship voyages started from the north Atlantic sea thus the major piracy attacks happened there. The cape of good hope was the place where almost every ship halt before proceeding towards the Indian ocean or to Guinea, Philippines, etc. Thus, the cape of good hope also became a place which attracted the pirates.
The piracy rate near England, France, Spain and the Netherlands was also too high as they were the major rulers of different countries in the world and thus had to sail more ships than a usual country.
INTERNATIONAL TRADE RELATIONS OF EUROPEAN COUNTRIES (MAJORLY THE BRITISH,FRENCH AND THE DUTCH) WITH DIFFERENT COUNTRIES WITH TIME:
ALGORITHM FOR ANALYSIS:
We used “Voyage To” and “Voyage From” Headed Columns to identify the ports and we used the port information to classify the trade relationship between two countries. Port Analysis was done with NLP BAG of Words Model in which the particular BAG had all the port names belonging to a particular country.
Let’s take the case of Indian ports. We created the BAG of port names. Then we looped through Voyage from and Voyage to and if any of the names matched into a bag of words, then that index was recorded. In this way, North America & South America was also analysed. Then the nationality of SHIPs was plotted against time vs % of total frequency to analyse different ship routes frequency over time with a given country.
The data derived from here will give us a trade relation state between two countries and their variability over time.
1. INDIA
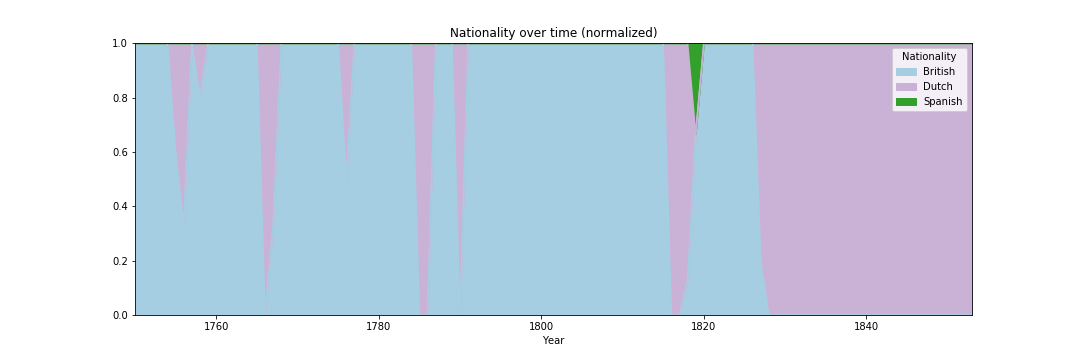
As India was under British Control since early 18th century thus we can see the percentage of the British ship on Indian port is maximum. There is very little involvement of Dutch in the Indian trade and almost nil for the Spanish. The French didn’t come to India during 1750-1850. It is quite clear that in the 1830s Dutch increased their trade relationship with India.
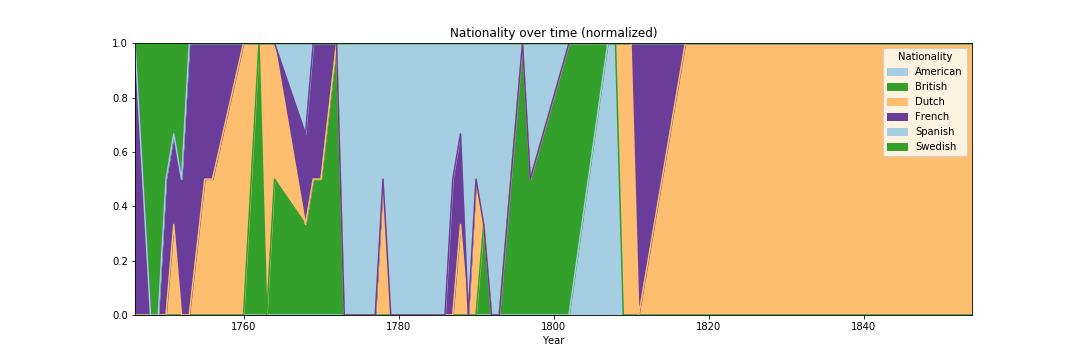
2. North America
We can see the ship routes of the French till 1763. They were ruling over North America from the end of the 17th century till 1763 as they lost the seven years war and was dethroned in North America. Thus, the involvement of the French in the trades was reduced to zero till 1790.
The Dutch were not constant with the trade with North America as they had a very small empire there and it was not for a long time too. We can the increasing and decreasing trend of the ship voyages of the Dutch during this time span.
The British empire in North America consisted of the northern part of the continent and as the land was not cultivable to produce any crop like opium etc. so they didn’t bother going there rather going to India and Australia to get the best land. Thus, we can only see British ships until the mid-1770s.
The Spanish had a huge empire in North America consisting of most of the southern part of the continent thus we can the huge ship voyages during this time span. There is some fluctuation in the ship voyages near 1815 as they lost all the wars and lost their kingdom in these areas.
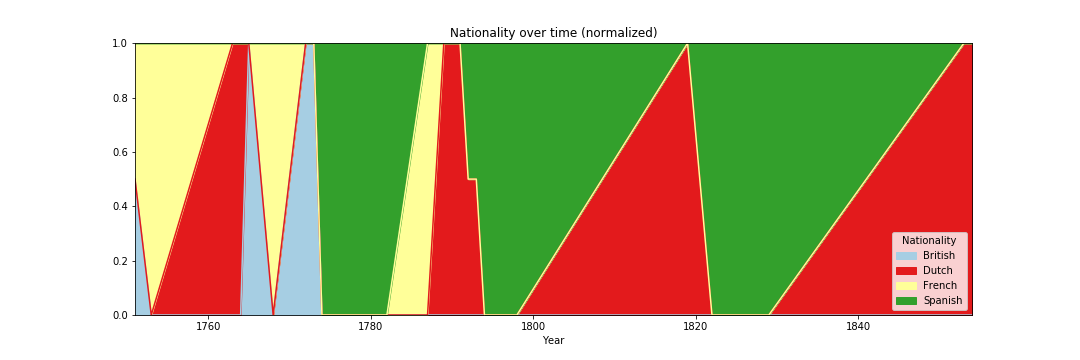
3. South America
The Spanish ruled over most of the north-eastern part of South America thus we can see maximum no of Spanish ships coming to this continent till 1813 as they lost all their kingdom in the war.
All the other countries had small empires in South America, so their ship voyages are quite low as compared to the Spanish. Thus, we can see the rapid fluctuating trend of the graph (Voyages) until 1815.
After 1815, the Dutch were the only country coming to South America as it was one of the nearest kingdoms from their native land.
PS
Feedback/Comments/suggestions, as well as contributions on this blog are welcome.
© Tekenlight Solutions Pvt Ltd 2019. All Rights Reserved.
Contact us: sudheer.hr@tekenlight.com
github.com/Tekenlight
Disclaimer: This blog is built using Jekyll and is heavily inspired by Tom Preston-Werner's personal blog

